Capacity planning#
General capacity planning advice for JupyterHub is hard to give, because it depends almost entirely on what your users are doing, and what JupyterHub users do varies wildly in terms of resource consumption.
There is no single answer to “I have X users, what resources do I need?” or “How many users can I support with this machine?”
Here are three typical Jupyter use patterns that require vastly different resources:
Learning: negligible resources because computation is mostly idle, e.g. students learning programming for the first time
Production code: very intense, sustained load, e.g. training machine learning models
Bursting: mostly idle, but needs a lot of resources for short periods of time (interactive research often looks like this)
But just because there’s no single answer doesn’t mean we can’t help. So we have gathered here some useful information to help you make your decisions about what resources you need based on how your users work, including the relative invariants in terms of resources that JupyterHub itself needs.
JupyterHub infrastructure#
JupyterHub consists of a few components that are always running. These take up very little resources, especially relative to the resources consumed by users when you have more than a few.
As an example, an instance of mybinder.org (running JupyterHub 1.5.0), running with typically ~100-150 users has:
Component |
CPU (mean/peak) |
Memory (mean/peak) |
|---|---|---|
Hub |
4% / 13% |
(230 MB / 260 MB) |
Proxy |
6% / 13% |
(47 MB / 65 MB) |
So it would be pretty generous to allocate ~25% of one CPU core and ~500MB of RAM to overall JupyterHub infrastructure.
The rest is going to be up to your users. Per-user overhead from JupyterHub is typically negligible up to at least a few hundred concurrent active users.
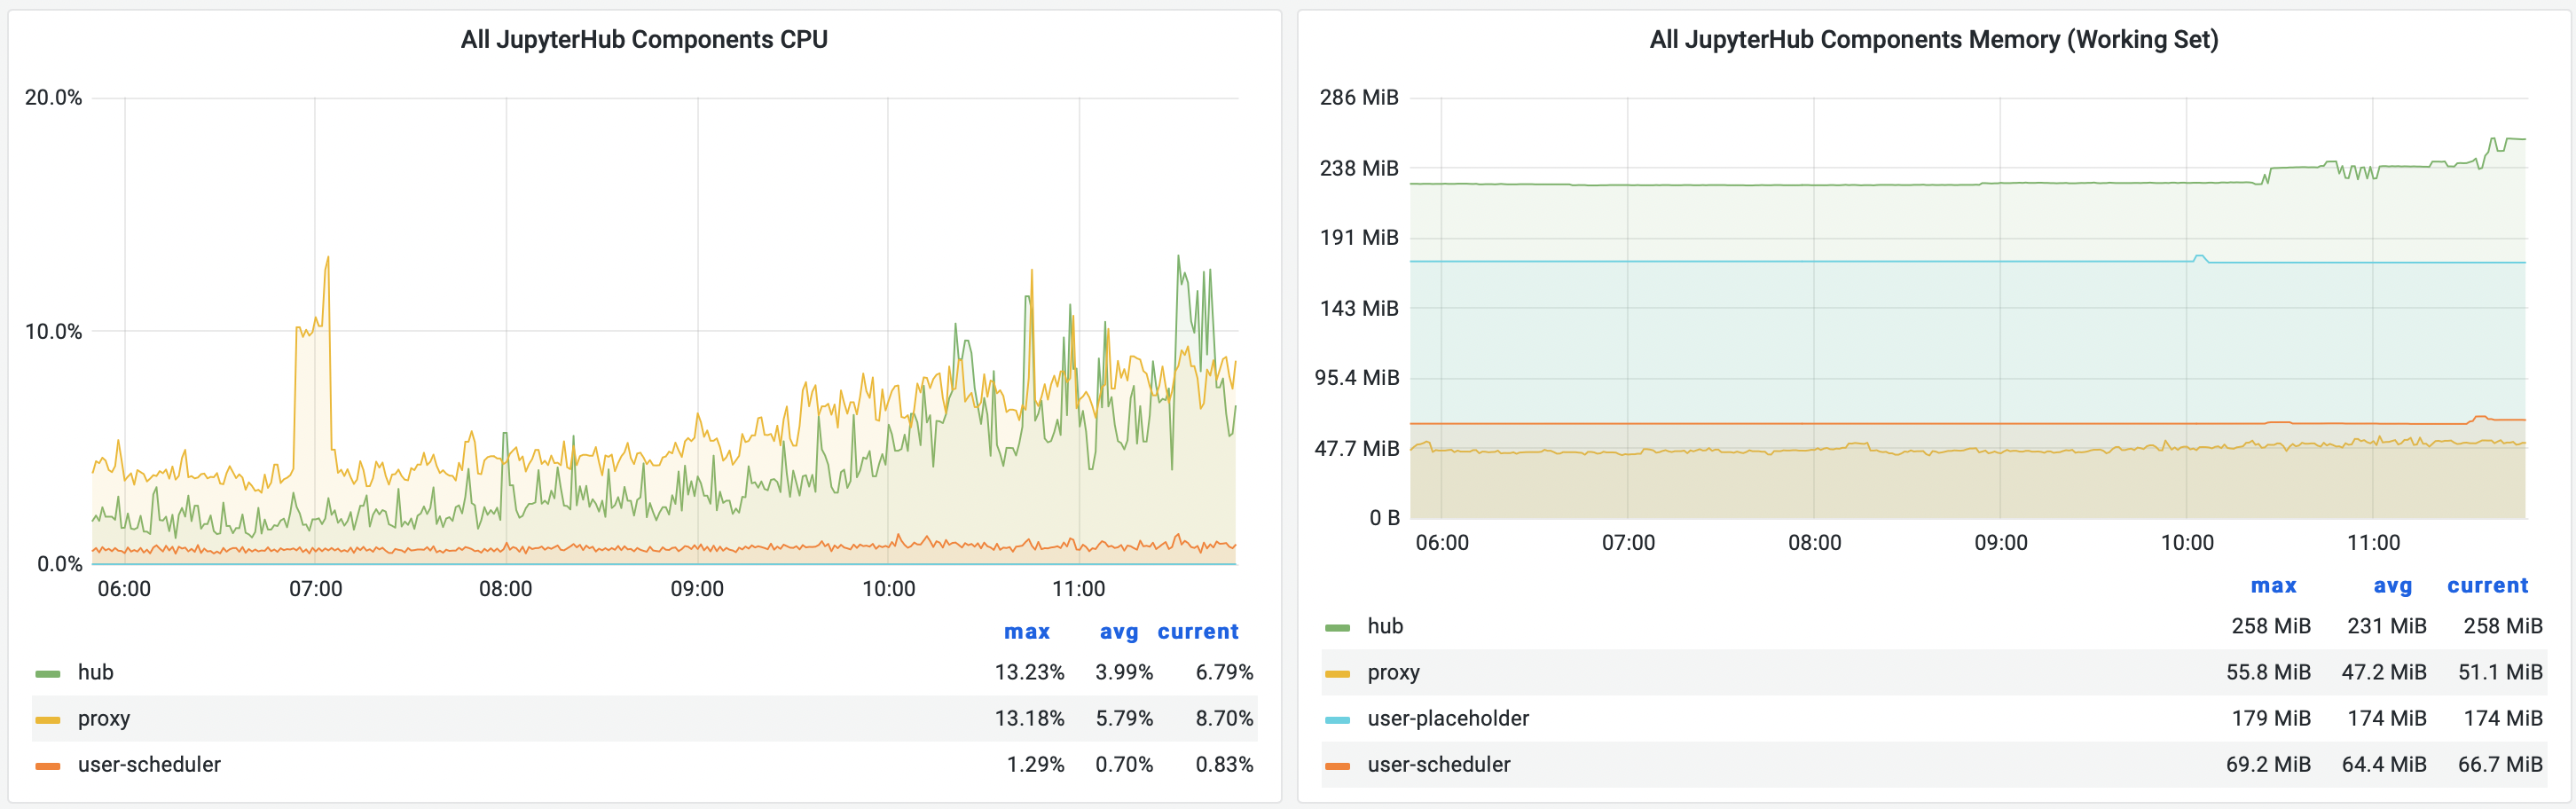
JupyterHub component resource usage for mybinder.org.#
Factors to consider#
Static vs elastic resources#
A big factor in planning resources is: how much does it cost to change your mind? If you are using a single shared machine with local storage, migrating to a new one because it turns out your users don’t fit might be very costly. You will have to get a new machine, set it up, and maybe even migrate user data.
On the other hand, if you are using ephemeral resources, such as node pools in Kubernetes, changing resource types costs close to nothing because nodes can automatically be added or removed as needed.
Take that cost into account when you are picking how much memory or cpu to allocate to users.
Static resources (like the-littlest-jupyterhub) provide for more stable, predictable costs, but elastic resources (like zero-to-jupyterhub) tend to provide lower overall costs (especially when deployed with monitoring allowing cost optimizations over time), but which are less predictable.
Limit vs Request for resources#
Many scheduling tools like Kubernetes have two separate ways of allocating resources to users. A Request or Reservation describes how much resources are set aside for each user. Often, this doesn’t have any practical effect other than deciding when a given machine is considered ‘full’. If you are using expandable resources like an autoscaling Kubernetes cluster, a new node must be launched and added to the pool if you ‘request’ more resources than fit on currently running nodes (a cluster scale-up event). If you are running on a single VM, this describes how many users you can run at the same time, full stop.
A Limit, on the other hand, enforces a limit to how much resources any given user can consume. For more information on what happens when users try to exceed their limits, see Oversubscribed CPU is okay, running out of memory is bad.
In the strictest, safest case, you can have these two numbers be the same. That means that each user is limited to fit within the resources allocated to it. This avoids oversubscription of resources (allowing use of more than you have available), at the expense (in a literal, this-costs-money sense) of reserving lots of usually-idle capacity.
However, you often find that a small fraction of users use more resources than others. In this case you may give users limits that go beyond the amount of resources requested. This is called oversubscribing the resources available to users.
Having a gap between the request and the limit means you can fit a number of typical users on a node (based on the request), but still limit how much a runaway user can gobble up for themselves.
Oversubscribed CPU is okay, running out of memory is bad#
An important consideration when assigning resources to users is: What happens when users need more than I’ve given them?
A good summary to keep in mind:
When tasks don’t get enough CPU, things are slow. When they don’t get enough memory, things are broken.
This means it’s very important that users have enough memory, but much less important that they always have exclusive access to all the CPU they can use.
This relates to Limits and Requests, because these are the consequences of your limits and/or requests not matching what users actually try to use.
A table of mismatched resource allocation situations and their consequences:
issue |
consequence |
|---|---|
Requests too high |
Unnecessarily high cost and/or low capacity. |
CPU limit too low |
Poor performance experienced by users |
CPU oversubscribed (too-low request + too-high limit) |
Poor performance across the system; may crash, if severe |
Memory limit too low |
Servers killed by Out-of-Memory Killer (OOM); lost work for users |
Memory oversubscribed (too-low request + too-high limit) |
System memory exhaustion - all kinds of hangs and crashes and weird errors. Very bad. |
Note that the ‘oversubscribed’ problem case is where the request is lower than typical usage, meaning that the total reserved resources isn’t enough for the total actual consumption. This doesn’t mean that all your users exceed the request, just that the limit gives enough room for the average user to exceed the request.
All of these considerations are important per node. Larger nodes means more users per node, and therefore more users to average over. It also means more chances for multiple outliers on the same node.
Example case for oversubscribing memory#
Take for example, this system and sampling of user behavior:
System memory = 8G
memory request = 1G, limit = 3G
typical ‘heavy’ user: 2G
typical ‘light’ user: 0.5G
This will assign 8 users to those 8G of RAM (remember: only requests are used for deciding when a machine is ‘full’). As long as the total of 8 users actual usage is under 8G, everything is fine. But the limit allows a total of 24G to be used, which would be a mess if everyone used their full limit. But not everyone uses the full limit, which is the point!
This pattern is fine if 1/8 of your users are ‘heavy’ because typical usage will be ~0.7G,
and your total usage will be ~5G (1 × 2 + 7 × 0.5 = 5.5).
But if 50% of your users are ‘heavy’ you have a problem because that means your users will be trying to use 10G (4 × 2 + 4 × 0.5 = 10),
which you don’t have.
You can make guesses at these numbers, but the only real way to get them is to measure (see Measuring user resource consumption).
CPU:memory ratio#
Most of the time, you’ll find that only one resource is the limiting factor for your users. Most often it’s memory, but for certain tasks, it could be CPU (or even GPUs).
Many cloud deployments have just one or a few fixed ratios of cpu to memory (e.g. ‘general purpose’, ‘high memory’, and ‘high cpu’). Setting your secondary resource allocation according to this ratio after selecting the more important limit results in a balanced resource allocation.
For instance, some of Google Cloud’s ratios are:
node type |
GB RAM / CPU core |
|---|---|
n2-highmem |
8 |
n2-standard |
4 |
n2-highcpu |
1 |
Idleness#
Jupyter being an interactive tool means people tend to spend a lot more time reading and thinking than actually running resource-intensive code. This significantly affects how much cpu resources a typical active user needs, but often does not significantly affect the memory.
Ways to think about this:
More idle users means unused CPU. This generally means setting your CPU limit higher than your CPU request.
What do your users do when they are running code? Is it typically single-threaded local computation in a notebook? If so, there’s little reason to set a limit higher than 1 CPU core.
Do typical computations take a long time, or just a few seconds? Longer typical computations means it’s more likely for users to be trying to use the CPU at the same moment, suggesting a higher request.
Even with idle users, parallel computation adds up quickly - one user fully loading 4 cores and 3 using almost nothing still averages to more than a full CPU core per user.
Long-running intense computations suggest higher requests.
Again, using mybinder.org as an example—we run around 100 users on 8-core nodes, and still see fairly low overall CPU usage on each user node. The limit here is actually Kubernetes’ pods per node, not memory or CPU. This is likely a extreme case, as many Binder users come from clicking links on webpages without any actual intention of running code.
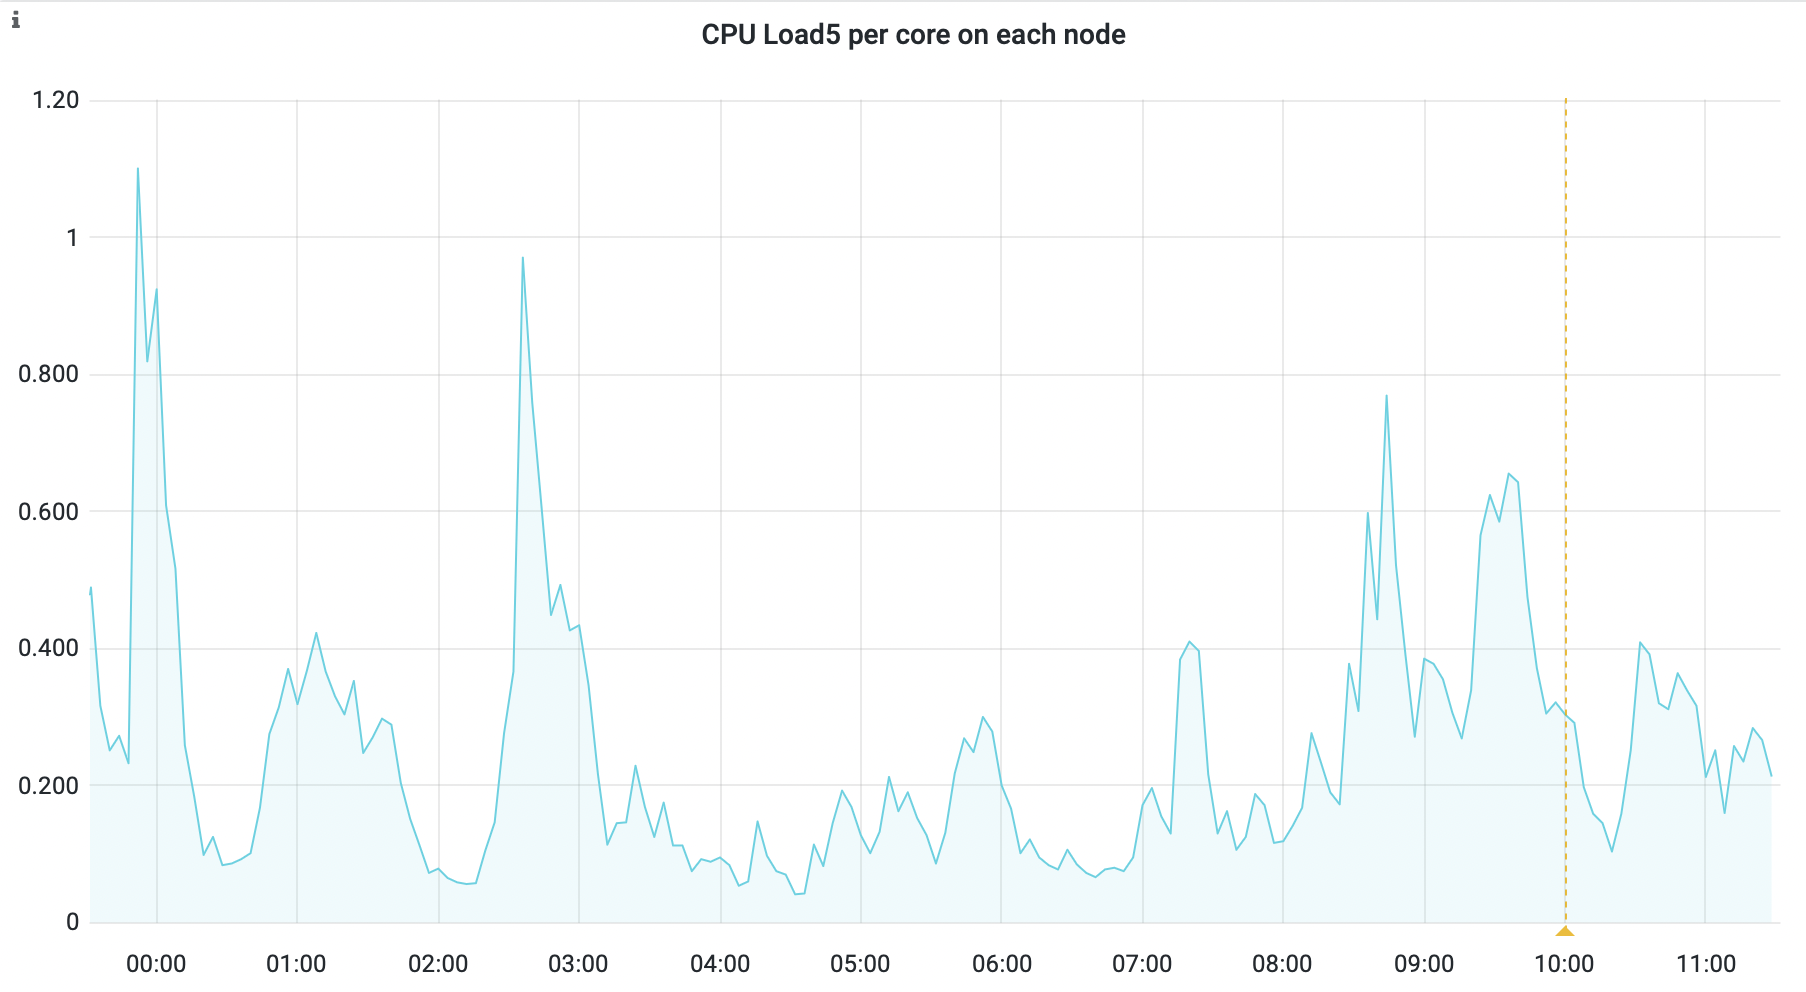
mybinder.org node CPU usage is low with 50-150 users sharing just 8 cores#
Concurrent users and culling idle servers#
Related to Idleness, all of these resource consumptions and limits are calculated based on concurrently active users, not total users. You might have 10,000 users of your JupyterHub deployment, but only 100 of them running at any given time. That 100 is the main number you need to use for your capacity planning. JupyterHub costs scale very little based on the number of total users, up to a point.
There are two important definitions for active user:
Are they actually there (i.e. a human interacting with Jupyter, or running code that might be )
Is their server running (this is where resource reservations and limits are actually applied)
Connecting those two definitions (how long are servers running if their humans aren’t using them) is an important area of deployment configuration, usually implemented via the JupyterHub idle culler service.
There are a lot of considerations when it comes to culling idle users that will depend:
How much does it save me to shut down user servers? (e.g. keeping an elastic cluster small, or keeping a fixed-size deployment available to active users)
How much does it cost my users to have their servers shut down? (e.g. lost work if shutdown prematurely)
How easy do I want it to be for users to keep their servers running? (e.g. Do they want to run unattended simulations overnight? Do you want them to?)
Like many other things in this guide, there are many correct answers leading to different configuration choices. For more detail on culling configuration and considerations, consult the JupyterHub idle culler documentation.
More tips#
Start strict and generous, then measure#
A good tip, in general, is to give your users as much resources as you can afford that you think they might use. Then, use resource usage metrics like prometheus to analyze what your users actually need, and tune accordingly. Remember: Limits affect your user experience and stability. Requests mostly affect your costs.
For example, a sensible starting point (lacking any other information) might be:
request:
  cpu: 0.5
  mem: 2G
limit:
  cpu: 1
  mem: 2G
(more memory if significant computations are likely - machine learning models, data analysis, etc.)
Some actions
If you see out-of-memory killer events, increase the limit (or talk to your users!)
If you see typical memory well below your limit, reduce the request (but not the limit)
If nobody uses that much memory, reduce your limit
If CPU is your limiting scheduling factor and your CPUs are mostly idle, reduce the cpu request (maybe even to 0!).
If CPU usage continues to be low, increase the limit to 2 or 4 to allow bursts of parallel execution.
Measuring user resource consumption#
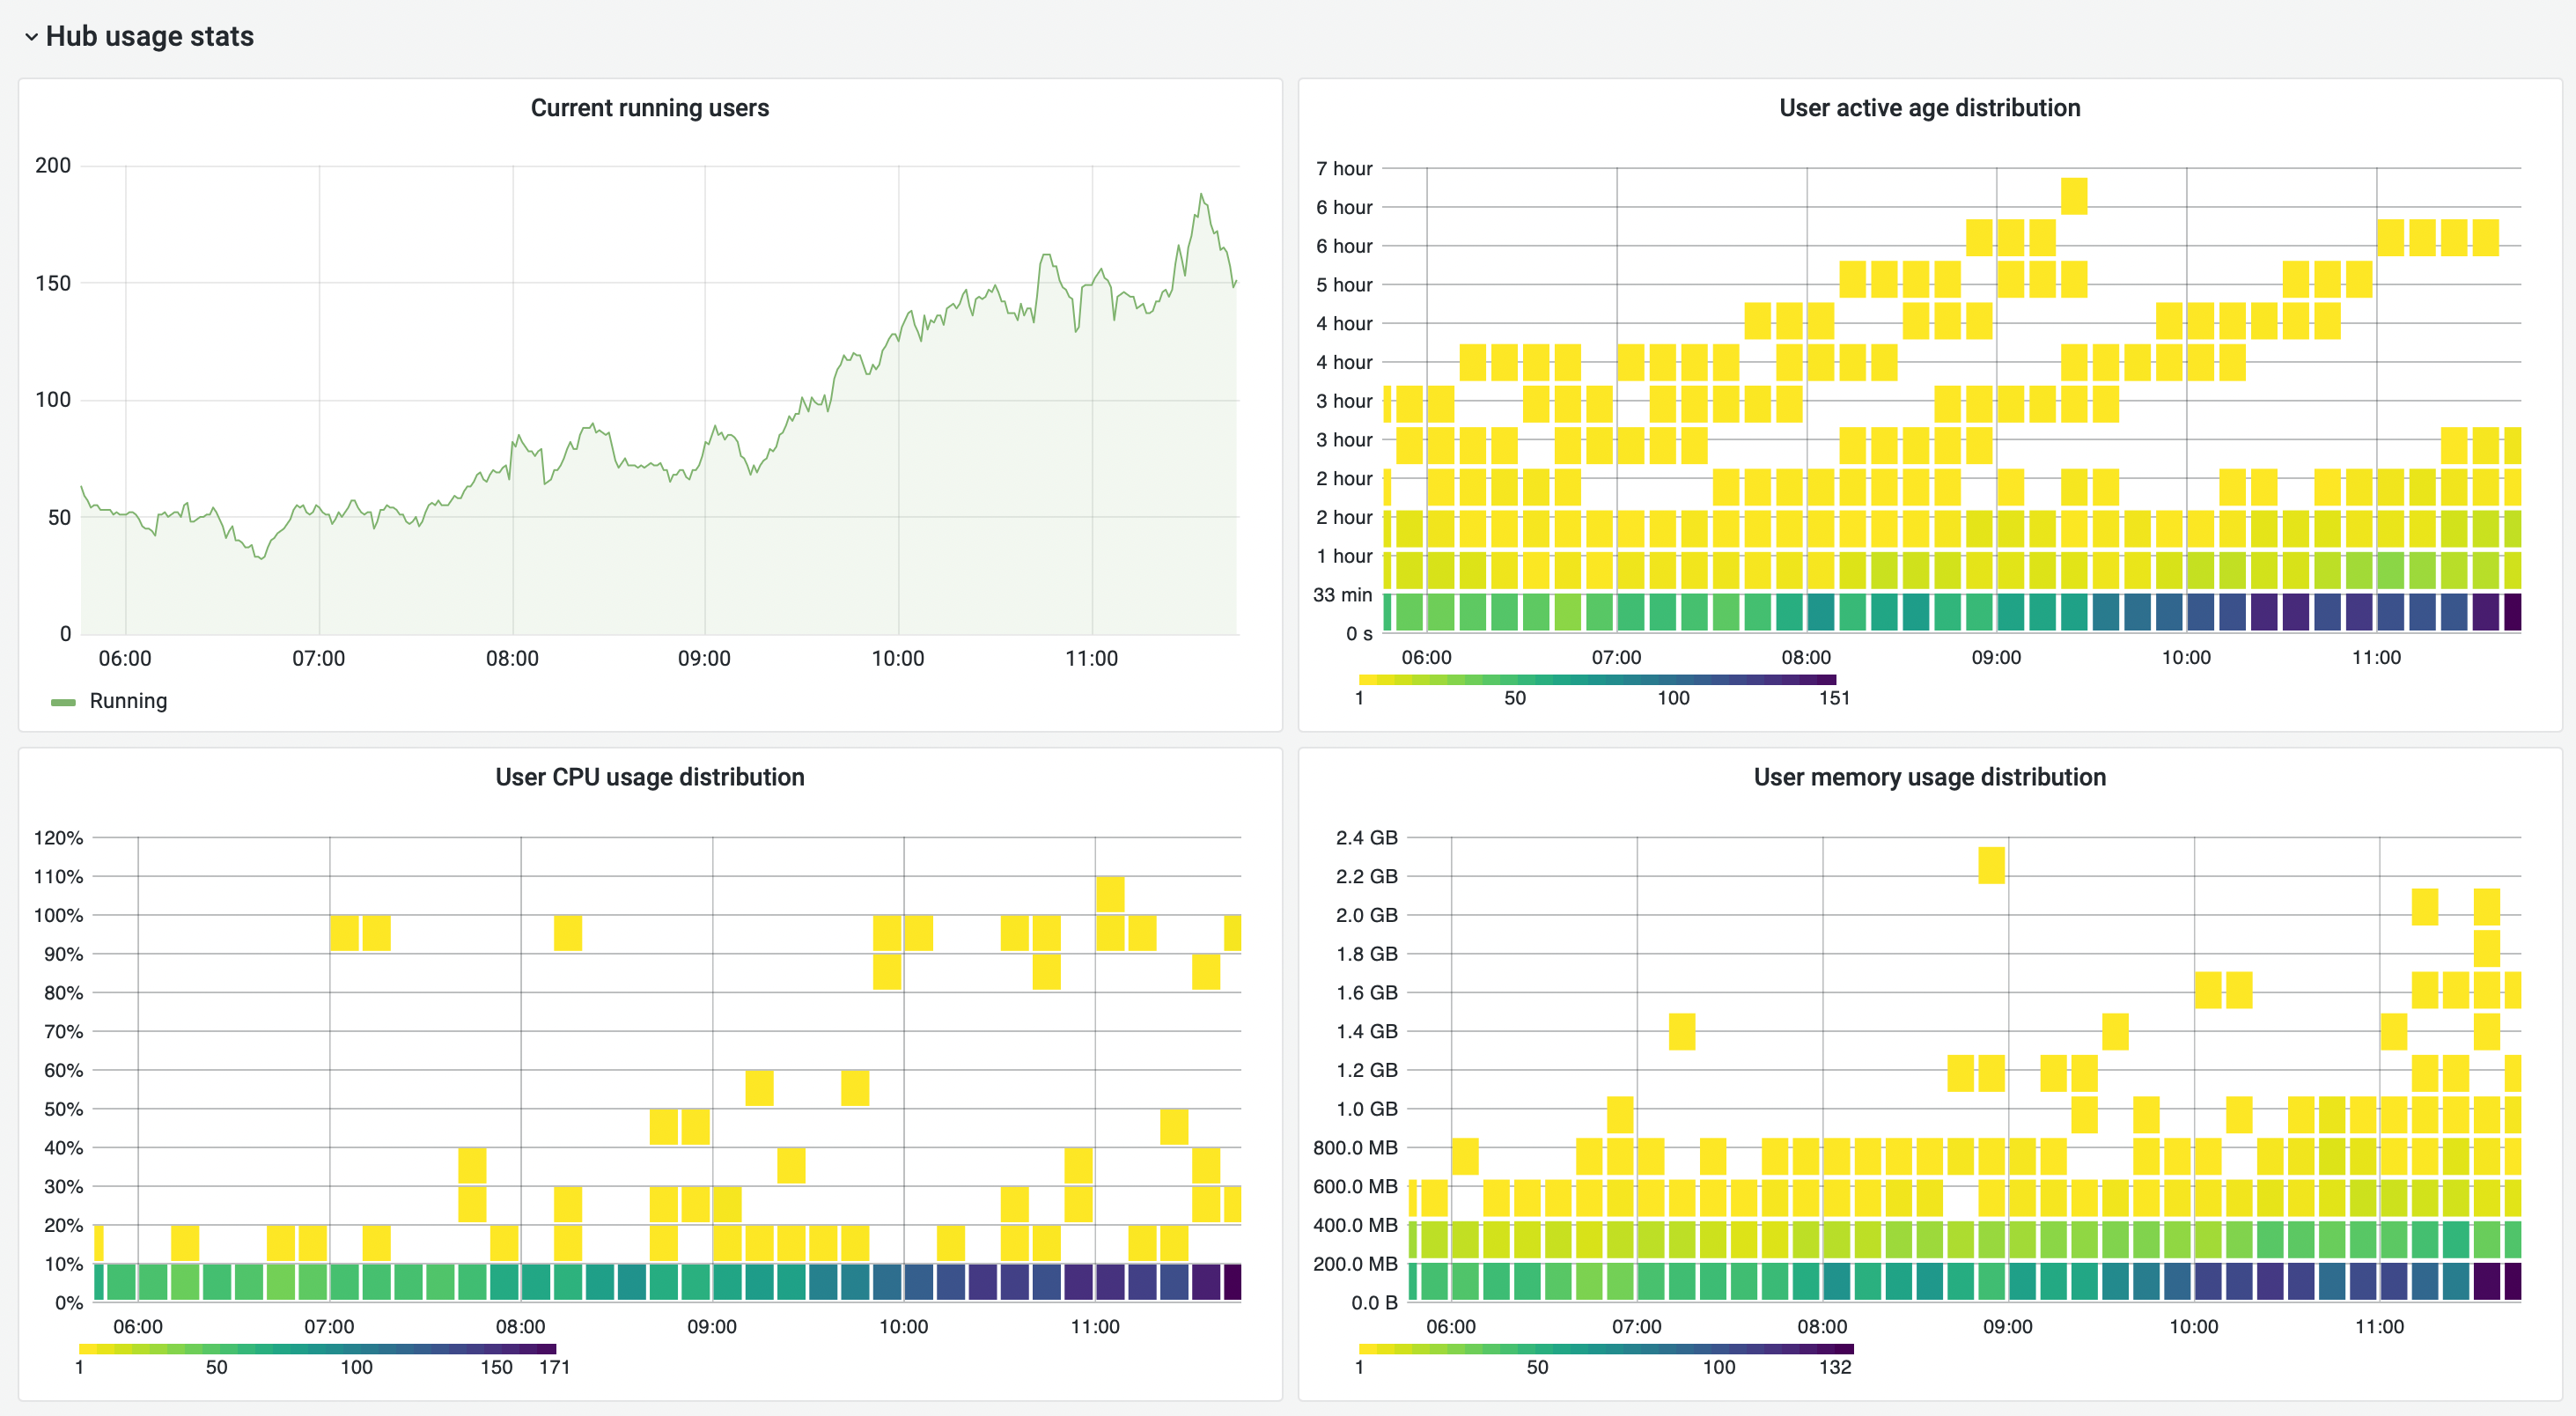
It is highly recommended to deploy monitoring services such as Prometheus and Grafana to get a view of your users’ resource usage. This is the only way to truly know what your users need.
JupyterHub has some experimental grafana dashboards you can use as a starting point, to keep an eye on your resource usage. Here are some sample charts from (again from mybinder.org), showing >90% of users using less than 10% CPU and 200MB, but a few outliers near the limit of 1 CPU and 2GB of RAM. This is the kind of information you can use to tune your requests and limits.
Measuring costs#
Measuring costs may be as important as measuring your users activity. If you are using a cloud provider, you can often use cost thresholds and quotas to instruct them to notify you if your costs are too high, e.g. “Have AWS send me an email if I hit X spending trajectory on week 3 of the month.” You can then use this information to tune your resources based on what you can afford. You can mix this information with user resource consumption to figure out if you have a problem, e.g. “my users really do need X resources, but I can only afford to give them 80% of X.” This information may prove useful when asking your budget-approving folks for more funds.
Additional resources#
There are lots of other resources for cost and capacity planning that may be specific to JupyterHub and/or your cloud provider.
Here are some useful links to other resources
Zero to JupyterHub documentation on
Cloud platform cost calculators: